Introduction:
The page describes the logic utilized to generate the text reports. as well as the development of the necessary equations and iterative subroutines required to convert the raw data into the diagrams on the screen.
Technique for the text Interpretations

1. Mathematics. See the Equations below. The pH and PCO2 are used to calculate: Standard Base Excess (SBE) and Bicarbonate.
2. Radial Search. See the Computing Strategy below. The Acid-Base diagram is searched to find: Location of the Zone; Magnitude of the 2 components.
Typical Zones
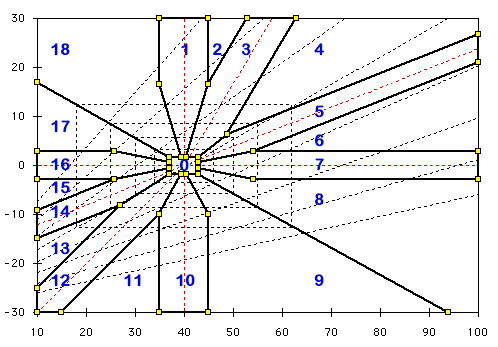
This diagram shows the radial zones employed to generate the sentence fragments. The numbers correspond to the radial search used to generate the code.
- 0. Normal
- 1. Pure Metabolic Acidosis
- 3. Metabolic Alkalosis (Compensated)
- 5. Chronic Respiratory Acidosis (Compensated)
- 7. Acute Respiratory Acidosis
- 10. Pure Metabolic Alkalosis
- 12. Metabolic Acidosis (Compensated)
- 14. Chronic Respiratory Alkalosis (Compensated)
- 16. Acute Respiratory Alkalosis
The expanding family of rectangles determine the choice of adjectives used to describe the degree of acidosis and alkalosis. Normal; Minimal; Mild; Moderate; Marked; Severe. The corners of these rectangles corresponds to the slope for pH = 7.4.
Computing Strategy.
The computer program conducts a radial search of the diagram to determine which sector (0 – 18) contains the data point. The sector determines which component, respiratory or metabolic, is dominant and therefore to be reported first. The adjective and the direction (acidosis or alkalosis) are derived from the value for each component. A final descriptive phrase is included when the location is characteristic of a chronic or an acute disturbance.
Grogono Equation.
[H+] (30.17 + BE) = 22.63 (PCO2 + 13.33)
A position on the diagram generates X and Y coordinates (PCO2 and SBE). An initial approximation is essential. Without it, the iterative process often diverges instead of converging. These equations provide a first approximation, e.g., to obtain bic from BE and PCO2.
[H+] x (30.17 + BE) = 22.63 x (PCO2 + 13.33)
bic = (BE + 30.17) / (0.94292 + 12.569 / PCO2)
Siggaard Andersen Equation.
It is a pleasure to thank Dr. Severinghaus for giving me these equations which are used in iterative procedures to obtain successively better approximations
SBE = 0.9287 (bic – 24.4 + 14.83 (pH – 7.4)), which can be simplified to:
SBE = 0.9287 * bic + 13.77 * pH – 124.58
bic = BE/0.9287 – 14.83 * pH +134.142
Modified Henderson Equation.
This is the equation used to derive [HCO3–] from pH and PCO2.
[H+] x [HCO3–] = 24 x PCO2
Iterative Procedure.
Moving the mouse over the diagram generates values for PCO2 and SBE. The following Javascript Code shows how these equations were employed to derive accurate bicarbonate values:
| function PCO2andBEtoBIC() { | |
| bic = (BE + 30.17) / (0.94292 + 12.569 / PCO2); | // bic approximation via Grogono equation |
| for (ii=0;ii<6;ii++) { | // iterative procedure six times |
| H = BICandPCO2toH(); | // [H+] via Modified Henderson Equation |
| bic = (bic + BEandHtoBIC())/2; | // split old value and new Siggaard-Anderson |
| } | |
| return bic; | // return bic |
| } | |
| function BEandPHtoPCO2() { | |
| return Math.exp((9-pH)*2.302585) *
((BE -13.77 * pH +124.578)/0.9287) / 24; |
//Siggaard-Anderson |
| } | |
| function BICandPCO2toH() { | |
| return (24*PCO2/bic); | //Modified Henderson Equation |
| } |
Javascript
When this website was introduced, Java was employed to run the diagrams and calculations. It was less than satisfactory originally and became more of a problem recently when constant updates were required. Javascript was adopted instead in 2017 and appears to provide the same, or better, functionality. Any advice or suggestions from Javascript-experts will be appreciated.
Conclusion:
For many acid-base disturbances the traditional approach to acid-base balance serves well. For the clinician, the three variables of greatest use are the pH, PCO2, and standard base excess (SBE). Stewart’s approach may be justified in examining and managing the more complex disturbances.